Faster performance reviews
Understand what happened without rebuilding the story from separate native dashboards and spreadsheets.
Platform · Analytics
VYNE Analytics brings the performance of your content, campaigns, and connected channels together so you can see what is gaining attention, what is falling behind, and where your next opportunity may be — without digging through separate platform dashboards.

Your analytics make more sense when they stay connected to the content, campaigns, schedules, and channels that created them. VYNE keeps that context together so performance is easier to understand.
Instead of treating analytics as a separate reporting job, VYNE helps turn what happened into clearer decisions about what to create, repeat, change, or leave behind.
Understand which posts, formats, topics, campaigns, and channels are getting attention and creating engagement.
Compare performance across your work so strong themes and weak spots are easier to recognize.
Use what the numbers are telling you to guide the next post, campaign, schedule, or creative decision.
Reach, engagement, clicks, audience response, and publishing performance matter more when you can understand what caused them. VYNE keeps analytics readable so you can move from a result to the reason behind it.
Insights is where those analytics come together inside VYNE, while the wider workflow keeps the supporting content, campaigns, and publishing activity close at hand.
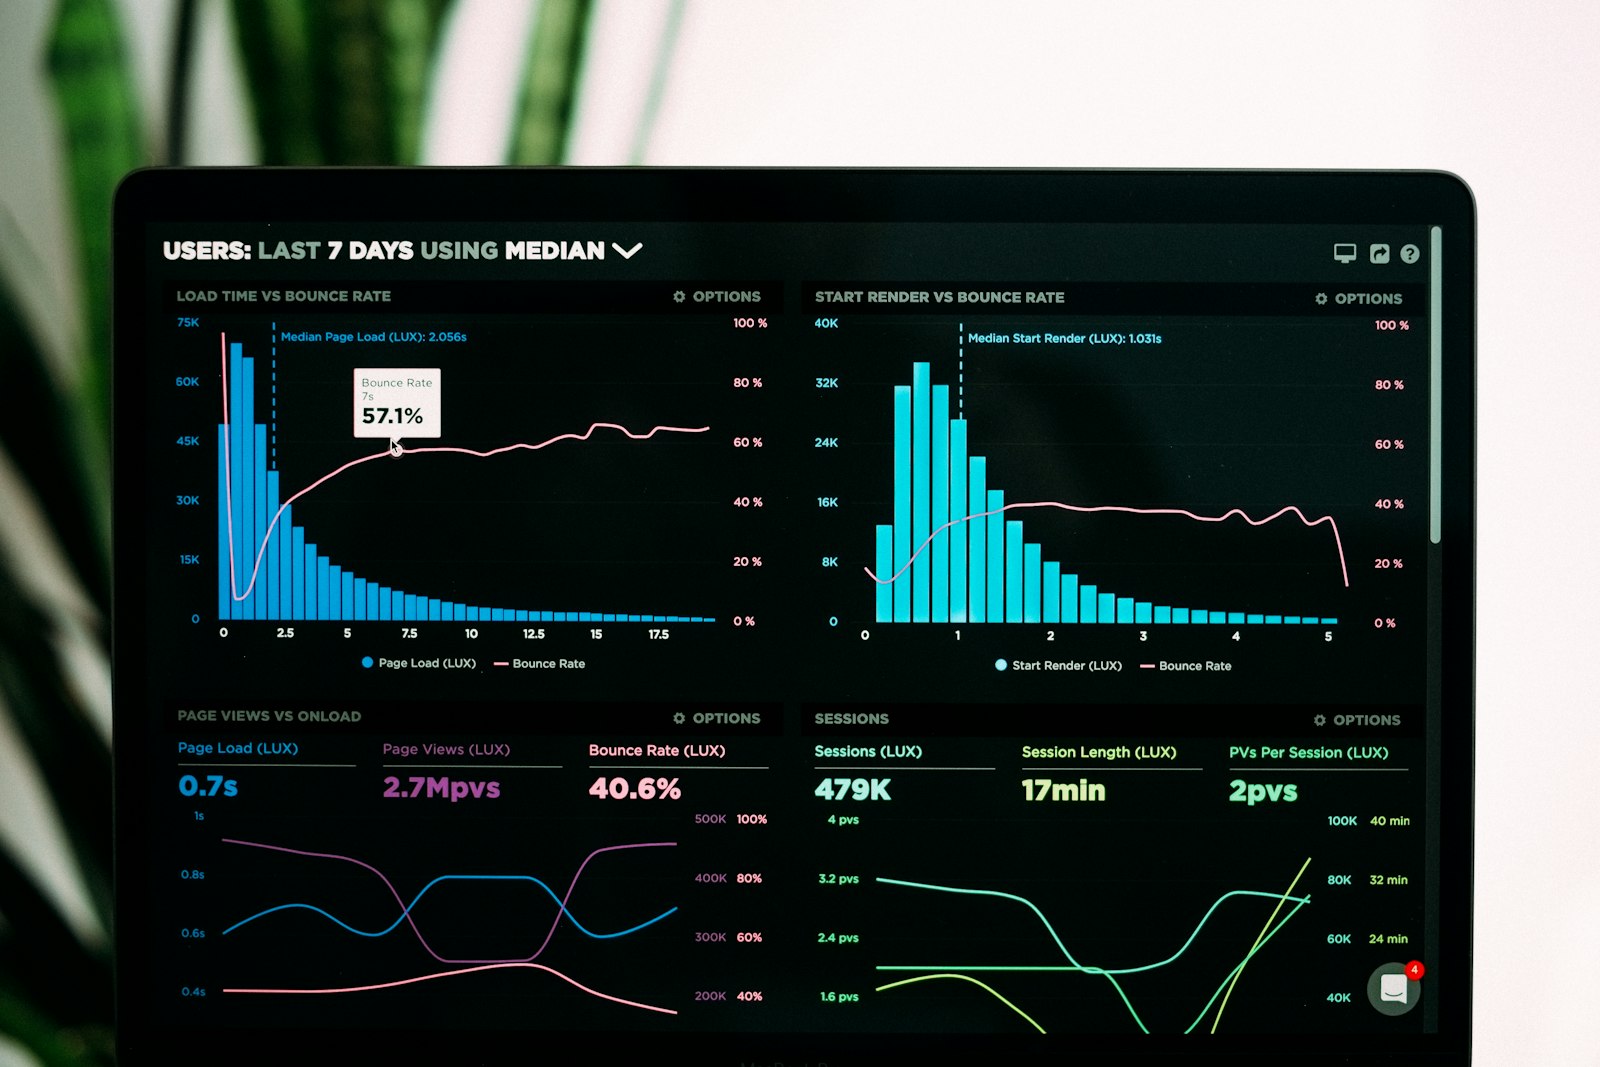
Performance tells you what happened. Currents helps show what is gaining attention around you, giving you another signal when deciding what deserves your attention next.
Together, your own analytics and Currents help you understand both how your content is performing and what is changing around it.
Step 1
Publishing, campaigns, schedules, and connected-channel activity create the foundation for useful analytics.
Step 2
Use Insights to see the signals behind your recent work and identify patterns across content, campaigns, and channels.
Step 3
Carry the strongest signals into Studio, Campaigns, Launchpad, and your next decisions instead of leaving analytics inside a report.
Understand what happened without rebuilding the story from separate native dashboards and spreadsheets.
See which formats, topics, and ideas deserve another run and which ones need a different approach.
Keep campaign activity and performance connected so results are easier to understand in context.
Bring performance signals closer to the same VYNE workflow where the work was created, planned, and published.
Help improve VYNE
VYNE uses PostHog for consent-based website analytics and campaign measurement. Form contents and contact details are not sent to analytics.